Chauvin Arnoux UK

Improving our own energy efficiency – Part 2

In the previous issue of Energy Manager Magazine, we described the beginning of a journey to improving the energy efficiency, and so reduce the consumption, of the Chauvin Arnoux UK offices. Following that initial logging session, and the subsequent changes that were made, more logging was performed using a PEL104 Power and Energy logger. This second part looks at the resulting data, and reveals the effects that the initial changes had on our consumption.

When we started this process, the suspended ceilings in the ground floor rooms had been fitted with a total of 48 units, each containing 4 x 1200mm 36-Watt florescent tubes, but those had now been replaced by 1200X600 46W LED panels.

Comparing the old and new energy logs for the lighting circuit, shown here together, it can be seen that prior to replacement, the fluorescent lighting consumed approximately 18.405A during the normal working day. And having now replaced them with LED panels, this was reduced to 13.350A.

What will probably turn out to be the biggest consumers of electrical energy in our facility, although they are currently switched off due to the heatwave we are experiencing, are a selection of wall mounted panel heaters located throughout the building. 9 rated at 3KW, 6 at 2KW and another 6 rated at 750W. The suspended ceilings in the ground floor rooms were fitted with a total of 48 units, each containing 4 x 1200mm 36-Watt florescent tubes, and the warehouse and entire upstairs floor lit by 72 standard 2387mm 100-Watt tubes. Specifically, there were 15 in the warehouse and 57 upstairs. Simply calculated, the 48 fittings totalling 6,912W, and 15 x 100W tubes in the warehouse, should give us a power consumption of 8412W downstairs, with another 5700W upstairs. Thus, with all the lights switched on, our theoretical total lighting power consumption would be 14,112W or 14.1KW.
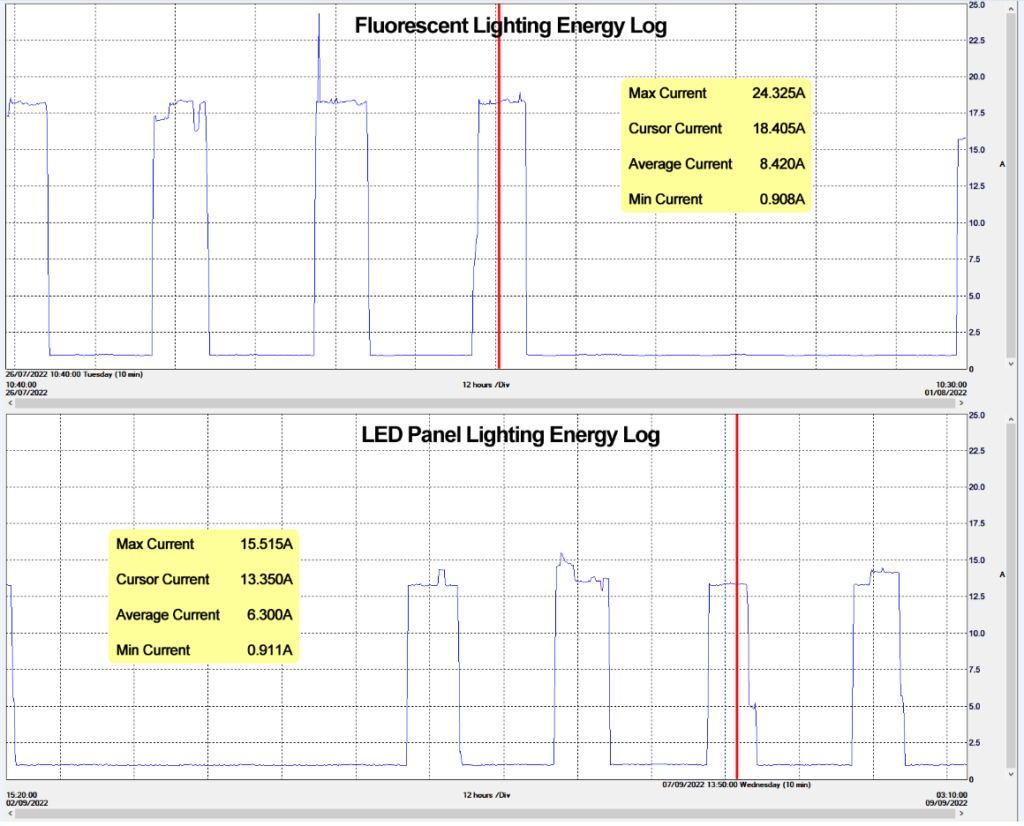
A little maths reveals that with a measured voltage of 243.6V and power factor of 0.905PF, we were consuming 4,058W. Following replacement with LED units the second log showed that this has gone down to 2,943W, essentially reducing our energy use for office lighting by 25%.

Accepting that we are a small, and mostly administrative business in the UK, and so that 25% only equates to 1kW which, with average unit price for business electricity in 2022 currently at 17.73 pence per kWh, will save us £354 per year. While not huge, that will repay the cost of the LED units in a few years, or sooner at the current rate of acceleration of energy costs. Of course, larger businesses with much more fluorescent lighting that are planning the move to LED could see a similar 25% saving adding up to much more monetarily speaking.

A similar 25% saving was obtained by changing the 100W fluorescent tubes lighting the rest of the building, to 36W T8 8ft LED direct replacements. One of the other items of improvement that we have made since we started looking at our energy efficiency concerns an electric water heater located in the ground floor kitchen area. Out of sight and out of mind was very much the case with this water heater as nobody particularly thought about it, or even realised it was there, and it was only discovered when our original logging results had identified a mysterious load that switched on for several minutes every couple of hours, day and night, 7 days a week. Only after some hunting around did we find the 10-year-old water heater hiding in an under-sink unit complete with 10-litre tank, feeding not only the kitchen sink but 2 wash basins in adjacent bathrooms. Based on its age alone this appliance would have been well behind modern water heating units with regards to efficiency rating, and analysis of our hot water usage in the 3 sinks concluded that our water usage was very small and not requiring of 10 litres of ready to use hot water anyway. Accordingly, it has now been replaced by an 8.8KW instant hot water unit. This type of heater also eliminates any out of hours usage, either overnight or over entire weekends, as it only consumes energy when the hot tap is run.
In terms of energy consumption, zooming into the 1 second sample logs it could be seen that the old heater came on for approximately 3 minutes every 140 minutes as it strove to keep the water inside at the set temperature. During these 3-minute periods it drew 2,192W and this occurred 10 times per 24-hour period. A total of 30 minutes per day at 2,192W equalling 1,096Wh, essentially 1KWh. A staff survey showed that it took approximately 7 seconds to “fill the sinks” and that this was being done on average 21 times a day. The meant that in a normal day the new water heater will consume 8.8KW for a total of 147s or 2.45 minutes. This equates to 0.352KWh in a day, which is one third of the energy used by the original heater, and there will be no further inadvertent overnight or weekend wasted energy. Discovering unknown appliances and out of hour use is another good reason to log actual energy use rather than assuming knowledge of the loads present in an installation. There is also good argument to say that any decent sized business should then continuously measure its energy usage with a permanently installed system. It can then chart consumption over time, identifying out of hours and seasonal usage, and monitor Power Factor degradation and Power Quality parameters such as harmonics. Thankfully nowadays you can get a PEL to perform whatever logging you need around the installation, and then semi-permanently and non-intrusively install it in the distribution cabinet for continuous monitoring. Modern PELs are designed to be so slim that they can be magnetically stuck to the inside of the cabinet door, or another convenient space, and left semi-permanently installed, while being safely locked away.
Rogowski coil current sensors, and magnetic voltage probes that can simply be stuck onto MCB screw heads, or permanently wired if preferred, enable an entirely non-intrusive connection to the supply. There’s no need for a competent trained electrician to have to switch off the facilities power while the PEL is being installed. These PELs can be self-powered from the installation to which they are connected, and plugged into the computer network for remote monitoring. Or just interrogated regularly through a tablet or smartphone. Quite simply, you could deploy a PEL around the site when you want to monitor certain pieces of equipment or departments, and then literally stick it in back in the distribution cabinet afterwards, and monitor on an ongoing basis. As and when you want to use it somewhere else, you can move it, use it, put it back again, and so on. Probably the most cost-effective way to obtain a temporary and permanent logging solution to reduce your energy use. With regards to our own energy logging and efficiency improvement project we will continue monitoring over the coming months and see what happens as the weather gets colder and the wall mounted panel heaters get switched on.

[vc_row css=”.vc_custom_1559969760488{margin-top: 90px !important;}”][vc_column][vc_column_text]

Improving our own energy efficiency – Part 2


In the previous issue of Energy Manager Magazine, we described the beginning of a journey to improving the energy efficiency, and so reduce the consumption, of the Chauvin Arnoux UK offices. Following that initial logging session, and the subsequent changes that were made, more logging was performed using a PEL104 Power and Energy logger. This second part looks at the resulting data, and reveals the effects that the initial changes had on our consumption.

When we started this process, the suspended ceilings in the ground floor rooms had been fitted with a total of 48 units, each containing 4 x 1200mm 36-Watt florescent tubes, but those had now been replaced by 1200X600 46W LED panels.

Comparing the old and new energy logs for the lighting circuit, shown here together, it can be seen that prior to replacement, the fluorescent lighting consumed approximately 18.405A during the normal working day. And having now replaced them with LED panels, this was reduced to 13.350A.[/vc_column_text][/vc_column][/vc_row][vc_row][vc_column width=”1/2″][vc_column_text]What will probably turn out to be the biggest consumers of electrical energy in our facility, although they are currently switched off due to the heatwave we are experiencing, are a selection of wall mounted panel heaters located throughout the building. 9 rated at 3KW, 6 at 2KW and another 6 rated at 750W.

The suspended ceilings in the ground floor rooms were fitted with a total of 48 units, each containing 4 x 1200mm 36-Watt florescent tubes, and the warehouse and entire upstairs floor lit by 72 standard 2387mm 100-Watt tubes. Specifically, there were 15 in the warehouse and 57 upstairs.

Simply calculated, the 48 fittings totalling 6,912W, and 15 x 100W tubes in the warehouse, should give us a power consumption of 8412W downstairs, with another 5700W upstairs. Thus, with all the lights switched on, our theoretical total lighting power consumption would be 14,112W or 14.1KW.[/vc_column_text][/vc_column][vc_column width=”1/2″][vc_single_image image=”4721″ img_size=”large” alignment=”right”][/vc_column][/vc_row][vc_row][vc_column width=”1/2″][vc_column_text]A little maths reveals that with a measured voltage of 243.6V and power factor of 0.905PF, we were consuming 4,058W. Following replacement with LED units the second log showed that this has gone down to 2,943W, essentially reducing our energy use for office lighting by 25%.

Accepting that we are a small, and mostly administrative business in the UK, and so that 25% only equates to 1kW which, with average unit price for business electricity in 2022 currently at 17.73 pence per kWh, will save us £354 per year. While not huge, that will repay the cost of the LED units in a few years, or sooner at the current rate of acceleration of energy costs. Of course, larger businesses with much more fluorescent lighting that are planning the move to LED could see a similar 25% saving adding up to much more monetarily speaking.

A similar 25% saving was obtained by changing the 100W fluorescent tubes lighting the rest of the building, to 36W T8 8ft LED direct replacements.[/vc_column_text][/vc_column][vc_column width=”1/2″][vc_single_image image=”4722″ img_size=”large” add_caption=”yes”][/vc_column][/vc_row][vc_row][vc_column][vc_column_text]One of the other items of improvement that we have made since we started looking at our energy efficiency concerns an electric water heater located in the ground floor kitchen area.

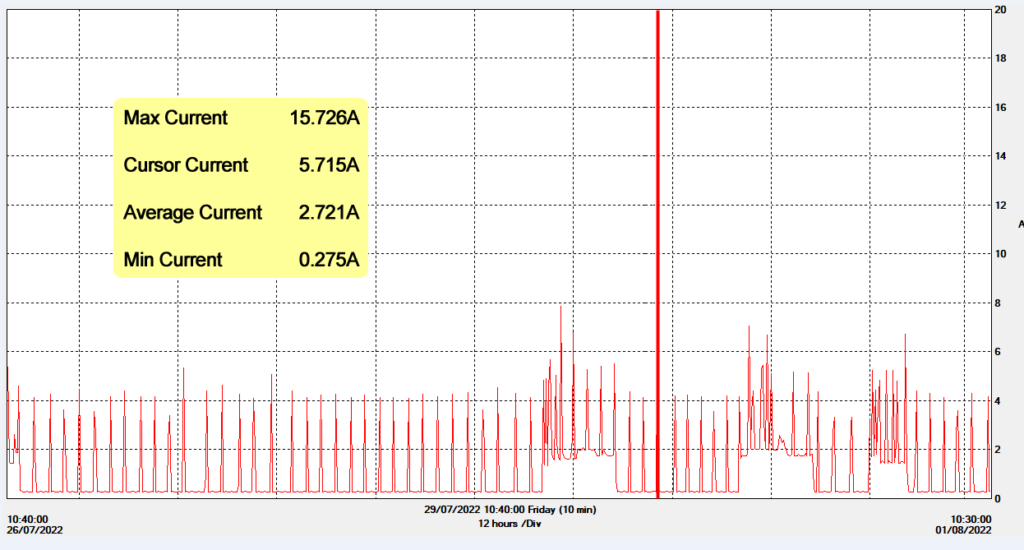
Out of sight and out of mind was very much the case with this water heater as nobody particularly thought about it, or even realised it was there, and it was only discovered when our original logging results had identified a mysterious load that switched on for several minutes every couple of hours, day and night, 7 days a week.

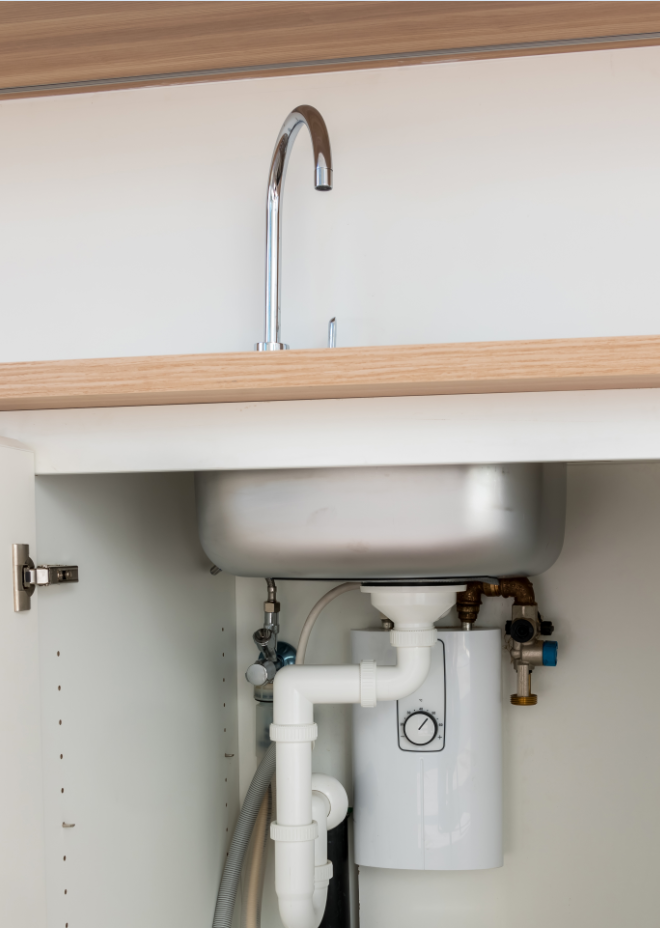
Only after some hunting around did we find the 10-year-old water heater hiding in an under-sink unit complete with 10-litre tank, feeding not only the kitchen sink but 2 wash basins in adjacent bathrooms.

Based on its age alone this appliance would have been well behind modern water heating units with regards to efficiency rating, and analysis of our hot water usage in the 3 sinks concluded that our water usage was very small and not requiring of 10 litres of ready to use hot water anyway. Accordingly, it has now been replaced by an 8.8KW instant hot water unit. This type of heater also eliminates any out of hours usage, either overnight or over entire weekends, as it only consumes energy when the hot tap is run.[/vc_column_text][/vc_column][/vc_row][vc_row][vc_column width=”1/2″][vc_column_text]In terms of energy consumption, zooming into the 1 second sample logs it could be seen that the old heater came on for approximately 3 minutes every 140 minutes as it strove to keep the water inside at the set temperature. During these 3-minute periods it drew 2,192W and this occurred 10 times per 24-hour period. A total of 30 minutes per day at 2,192W equalling 1,096Wh, essentially 1KWh.

A staff survey showed that it took approximately 7 seconds to “fill the sinks” and that this was being done on average 21 times a day. The meant that in a normal day the new water heater will consume 8.8KW for a total of 147s or 2.45 minutes. This equates to 0.352KWh in a day, which is one third of the energy used by the original heater, and there will be no further inadvertent overnight or weekend wasted energy.

Discovering unknown appliances and out of hour use is another good reason to log actual energy use rather than assuming knowledge of the loads present in an installation. There is also good argument to say that any decent sized business should then continuously measure its energy usage with a permanently installed system. It can then chart consumption over time, identifying out of hours and seasonal usage, and monitor Power Factor degradation and Power Quality parameters such as harmonics.

Thankfully nowadays you can get a PEL to perform whatever logging you need around the installation, and then semi-permanently and non-intrusively install it in the distribution cabinet for continuous monitoring. Modern PELs are designed to be so slim that they can be magnetically stuck to the inside of the cabinet door, or another convenient space, and left semi-permanently installed, while being safely locked away.[/vc_column_text][/vc_column][vc_column width=”1/2″][vc_single_image image=”4723″ img_size=”large” add_caption=”yes”][/vc_column][/vc_row][vc_row][vc_column][vc_single_image image=”4725″ img_size=”large”][/vc_column][/vc_row][vc_row][vc_column][vc_column_text]Rogowski coil current sensors, and magnetic voltage probes that can simply be stuck onto MCB screw heads, or permanently wired if preferred, enable an entirely non-intrusive connection to the supply. There’s no need for a competent trained electrician to have to switch off the facilities power while the PEL is being installed.

These PELs can be self-powered from the installation to which they are connected, and plugged into the computer network for remote monitoring. Or just interrogated regularly through a tablet or smartphone.

Quite simply, you could deploy a PEL around the site when you want to monitor certain pieces of equipment or departments, and then literally stick it in back in the distribution cabinet afterwards, and monitor on an ongoing basis. As and when you want to use it somewhere else, you can move it, use it, put it back again, and so on. Probably the most cost-effective way to obtain a temporary and permanent logging solution to reduce your energy use.

With regards to our own energy logging and efficiency improvement project we will continue monitoring over the coming months and see what happens as the weather gets colder and the wall mounted panel heaters get switched on.[/vc_column_text][/vc_column][/vc_row][vc_row][vc_column][vc_column_text][/vc_column_text][vc_btn title=”Download PDF” color=”orange” align=”center” link=”url:https%3A%2F%2Fcauk.tv%2Fwp-content%2Fuploads%2F2022%2F11%2FImproving-our-own-energy-efficiency-part-2.pdf||target:%20_blank|”][/vc_column][/vc_row]

Clicky